Контурные математические рисунки
Cпециально для
Арбуза составлены несколько интересных картинок, используя редактор “Maple10”. Приведены тексты команд с уравнениями:
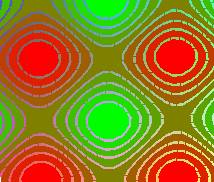
1.
restart;with(plots): contourplot3d(sin(x)+cos(y),x=-5..5,y=-5..5,filled=true,coloring=[red,green],thickness=3);
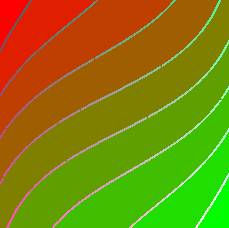
2.
contourplot3d(2*sin(x)+tan(y),x=-1..1,y=-1..1,filled=true,coloring=[red,green],thickness=3);
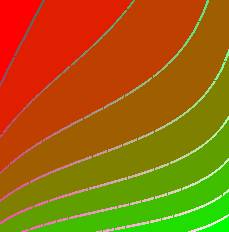
3.
contourplot3d(2*exp(x)+tan(y),x=-1..1,y=-1..1,filled=true,coloring=[red,green],thickness=3);
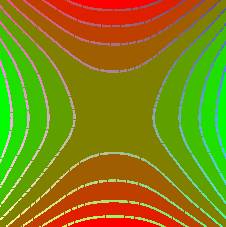
4.
contourplot3d(x^2-y^2+sin(y)+cos(x),x=-10..10,y=-10..10,filled=true,coloring=[red,green],thickness=3);
5.
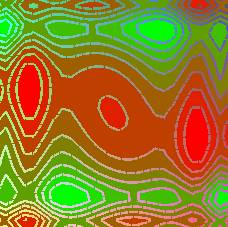
contourplot3d(sin(y^2)-cos(x^3)+sin(x^2)-cos(x)+sin(x*y),x=-2..2,y=-3..3,filled=true,coloring=[red,green],thickness=3);
6.
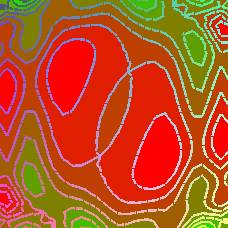
contourplot3d(sin(y^2)+cos(y*x^2)+sin(x^2)+cos(x)+sin(x*y),x=-2..2,y=-3..3,filled=true,coloring=[green,red],thickness=3);
7.
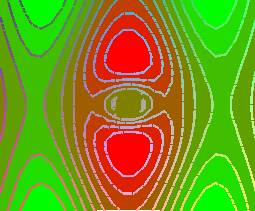
contourplot3d(sin(log(x^2+y^2))+cos(y),x=-5..5,y=-5..5,filled=true,coloring=[green,red],thickness=3);
Если кто-то воспользуется методом и
построит более интересные вещи – буду только рад.
Георгий Александров. Июнь 2006 г. Москва
|